
Statistical Skills
Dr. Liberman and Dr. Hefetz are skilled in various types of statistical tools such as structural equation modeling (SEM) and path analysis, analyses of variance and covariance and regression models, semi-parametric and non-parametric tests, see list below.
List of statistical modeling tools
Linear and non-linear regression, discrete choice and count (Poisson, Negative Binomial, zero inflated Poisson, two-part models, selection models); SEM of latent variables and calculated indicators; Latent cluster and profile analysis; Other clustering techniques; Confirmatory, exploratory and unrestricted factor analyses; Common method variance and bias detection and correction; Multilevel SEM and Longitudinal SEM with random growth and development effects, piecewise growth modeling; Time series analysis, tests of autocorrelation and partial autocorrelation, trend, non-parametric trend, shocks, and seasonal cleaning; Multi-Dimensional scaling; non-parametric comparisons and non-parametric interaction analyses.
Descriptive statistics, moments of centrality and dispersion
Univariate Mean, Mode, Median, Min, Max etc. by multiple categories; Bivariate correlations, partial correlation, categorical correlation analysis.
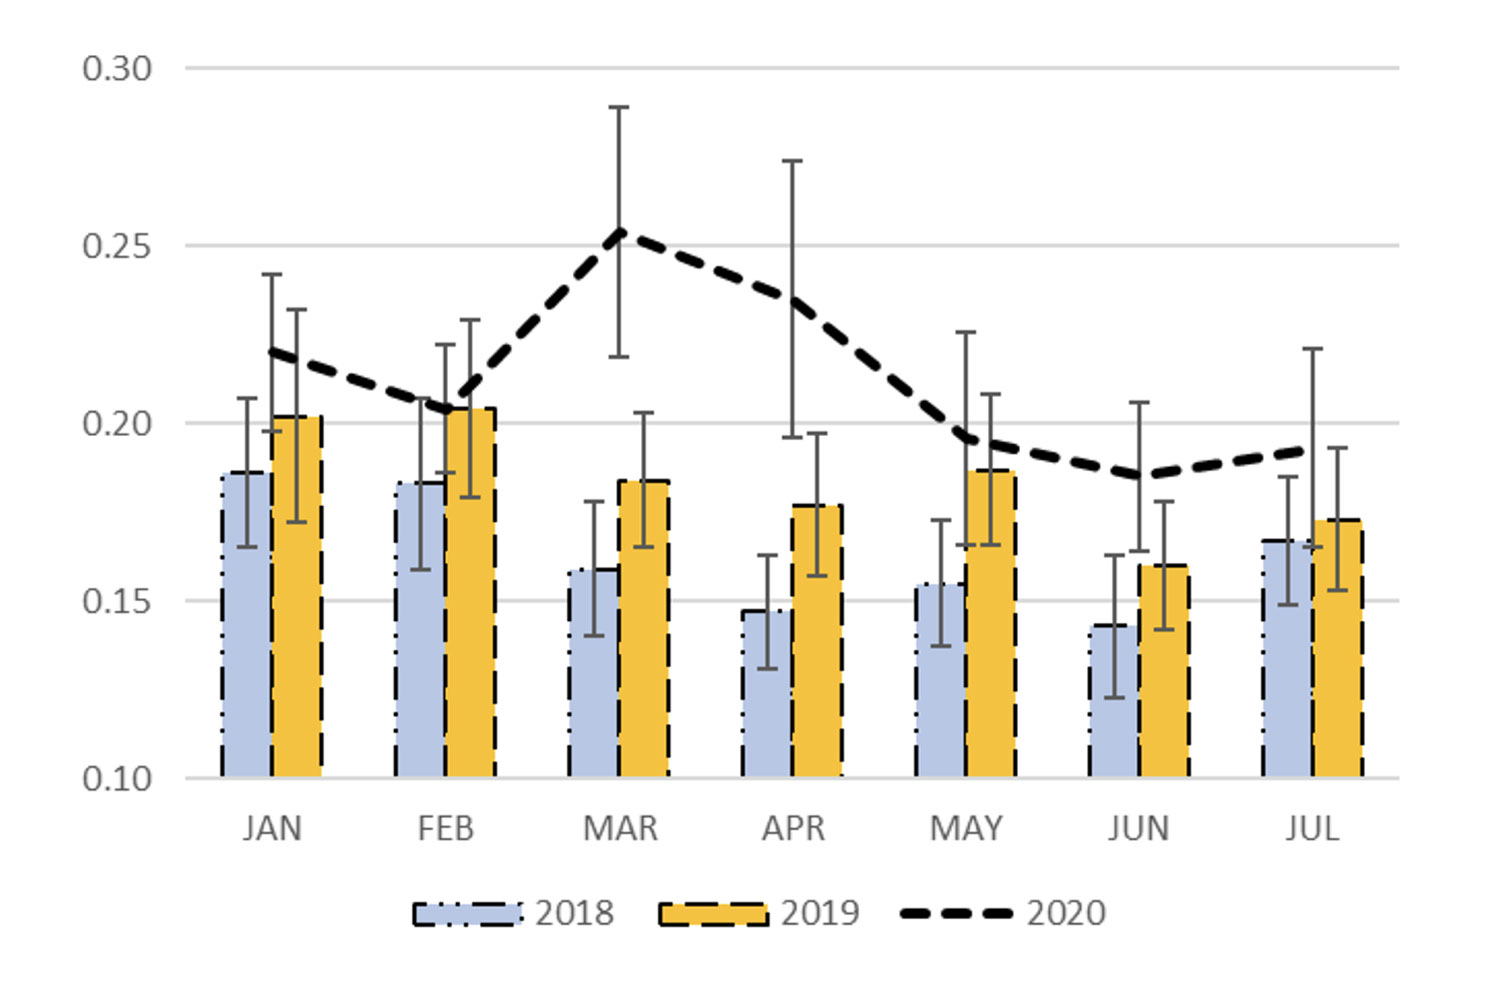
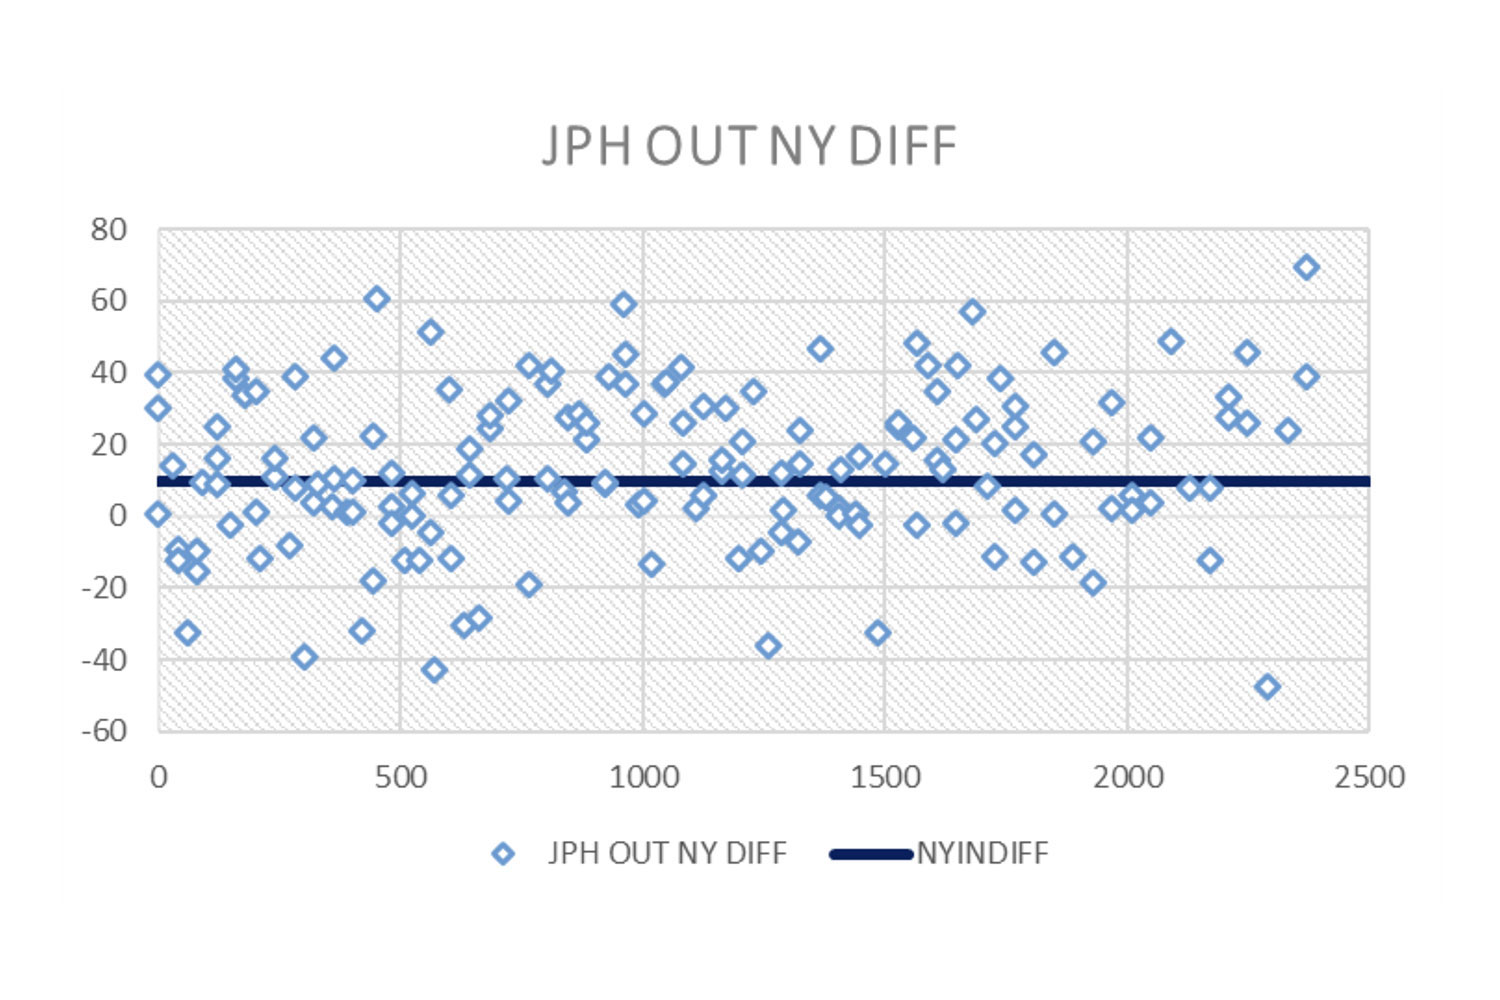
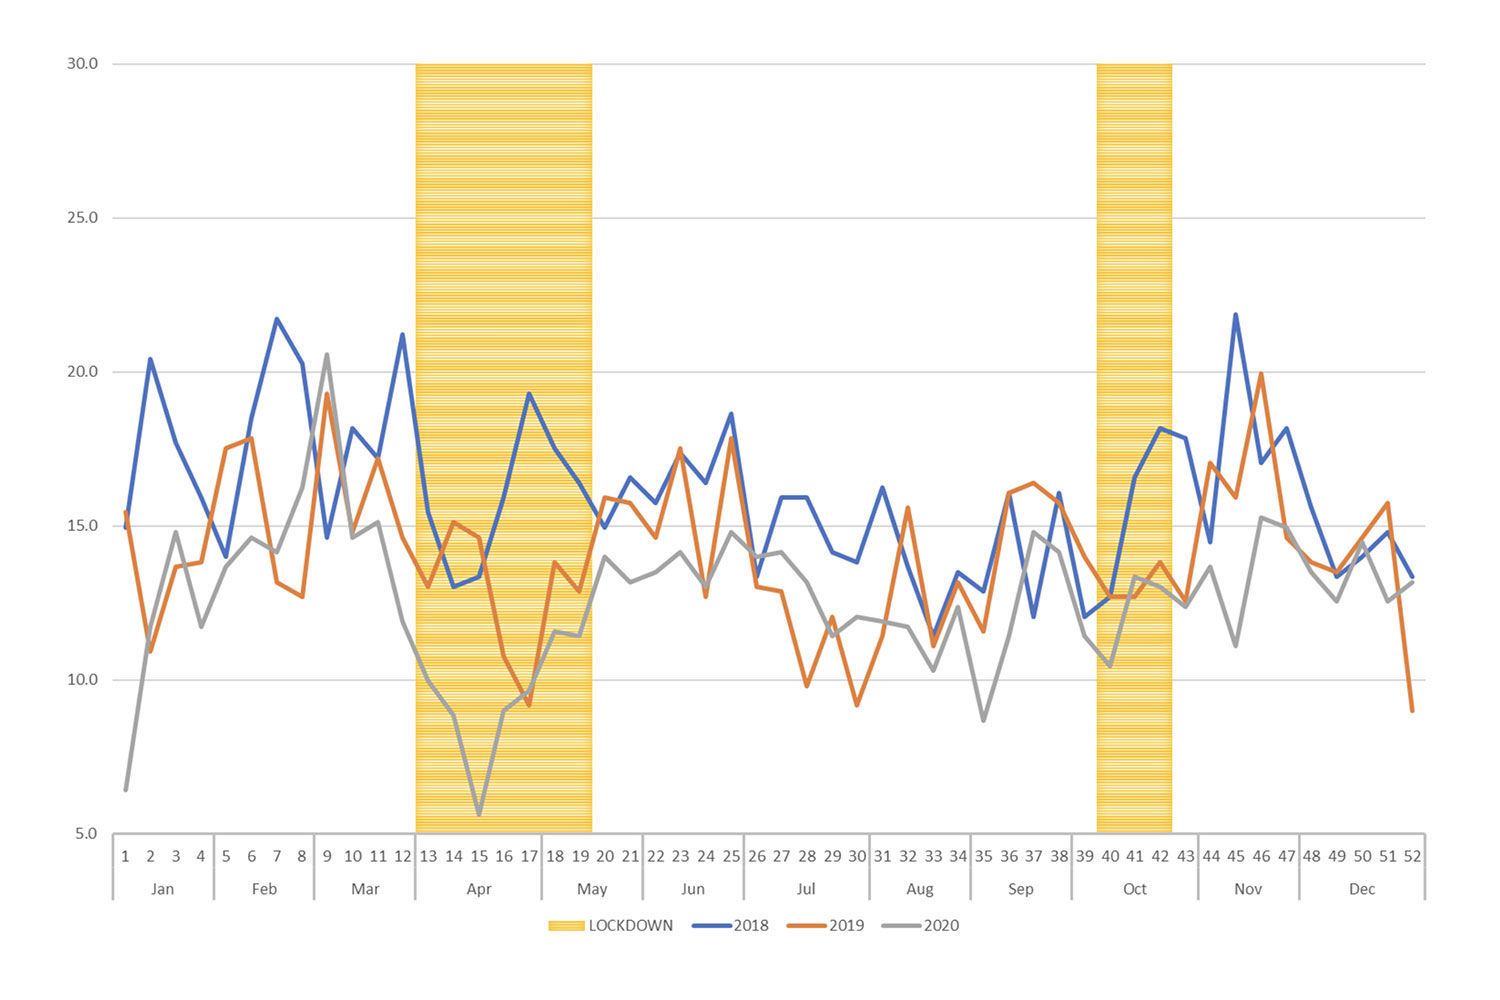
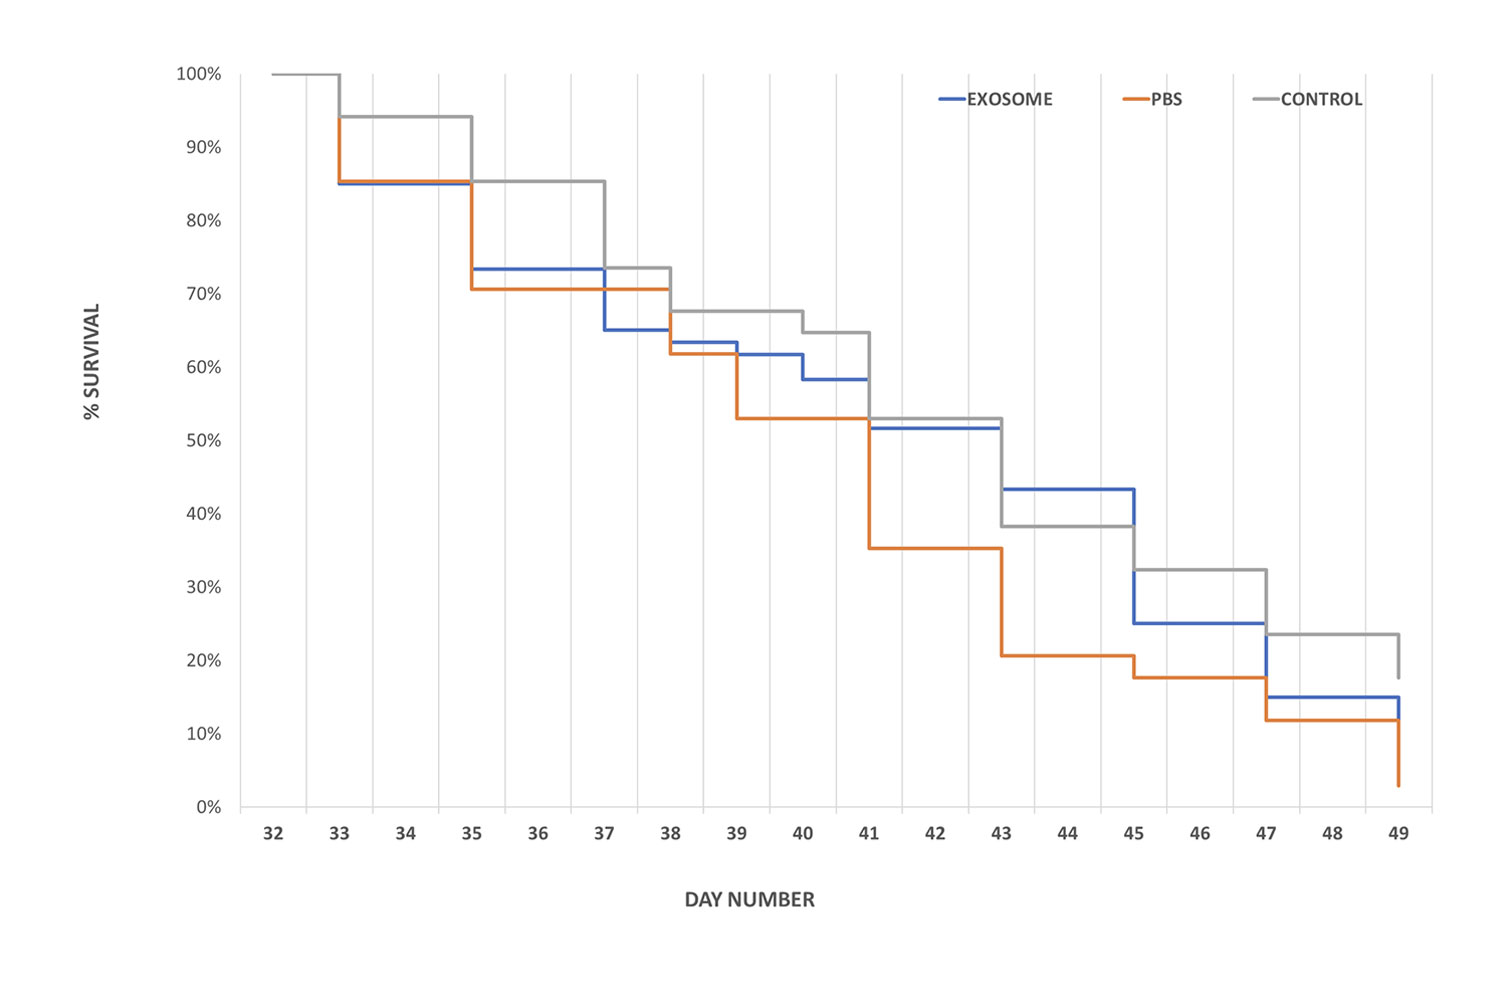
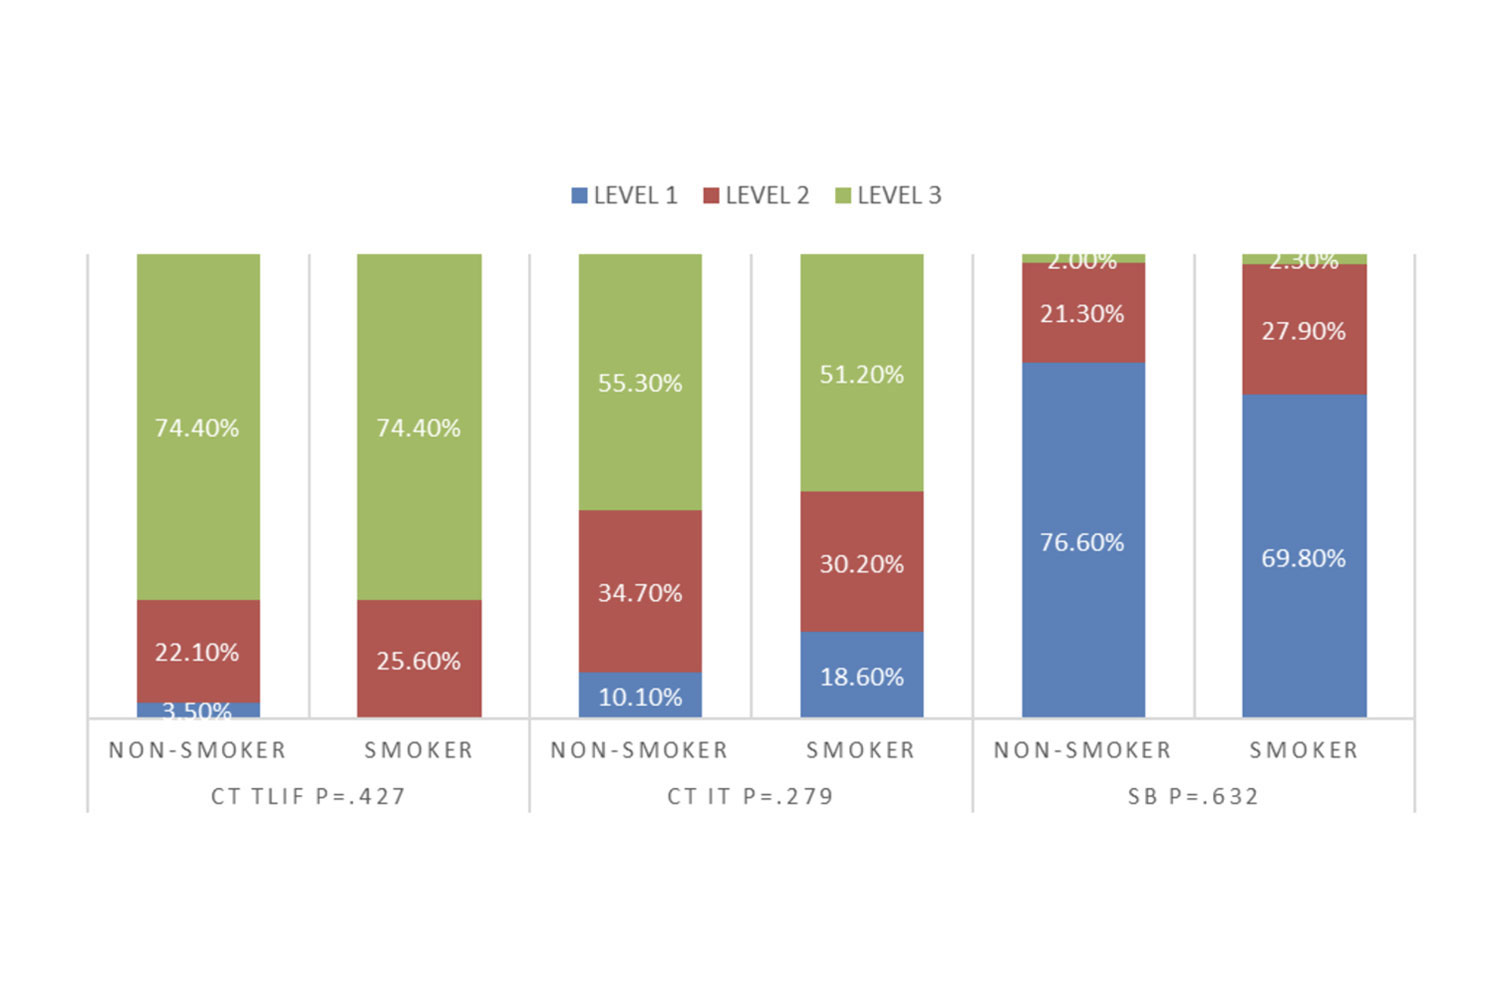
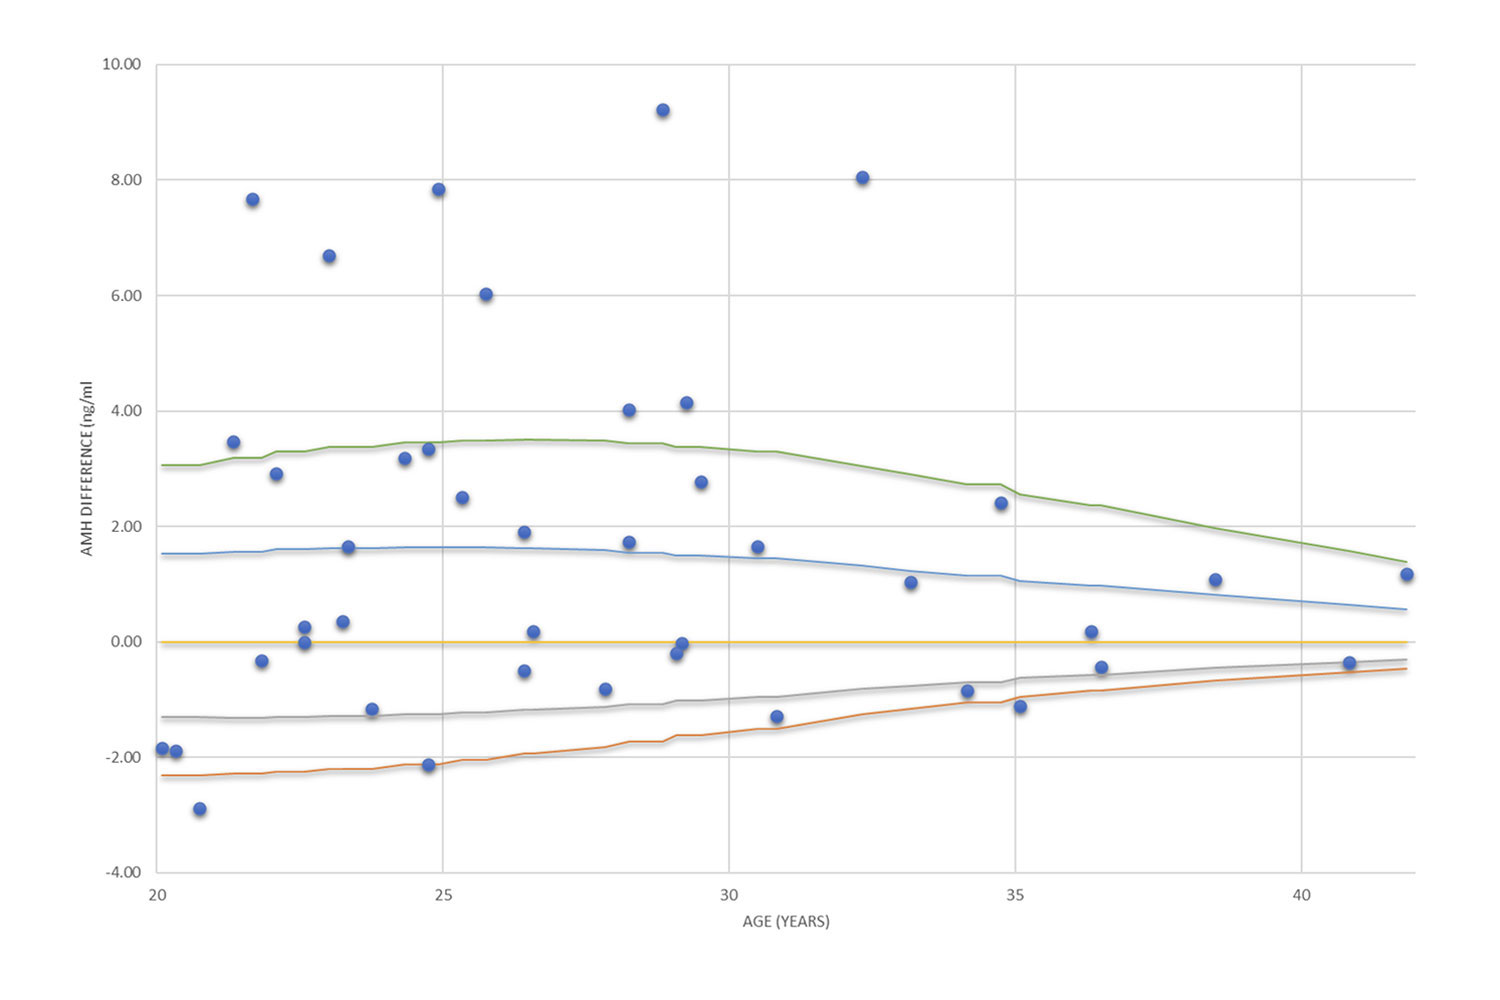
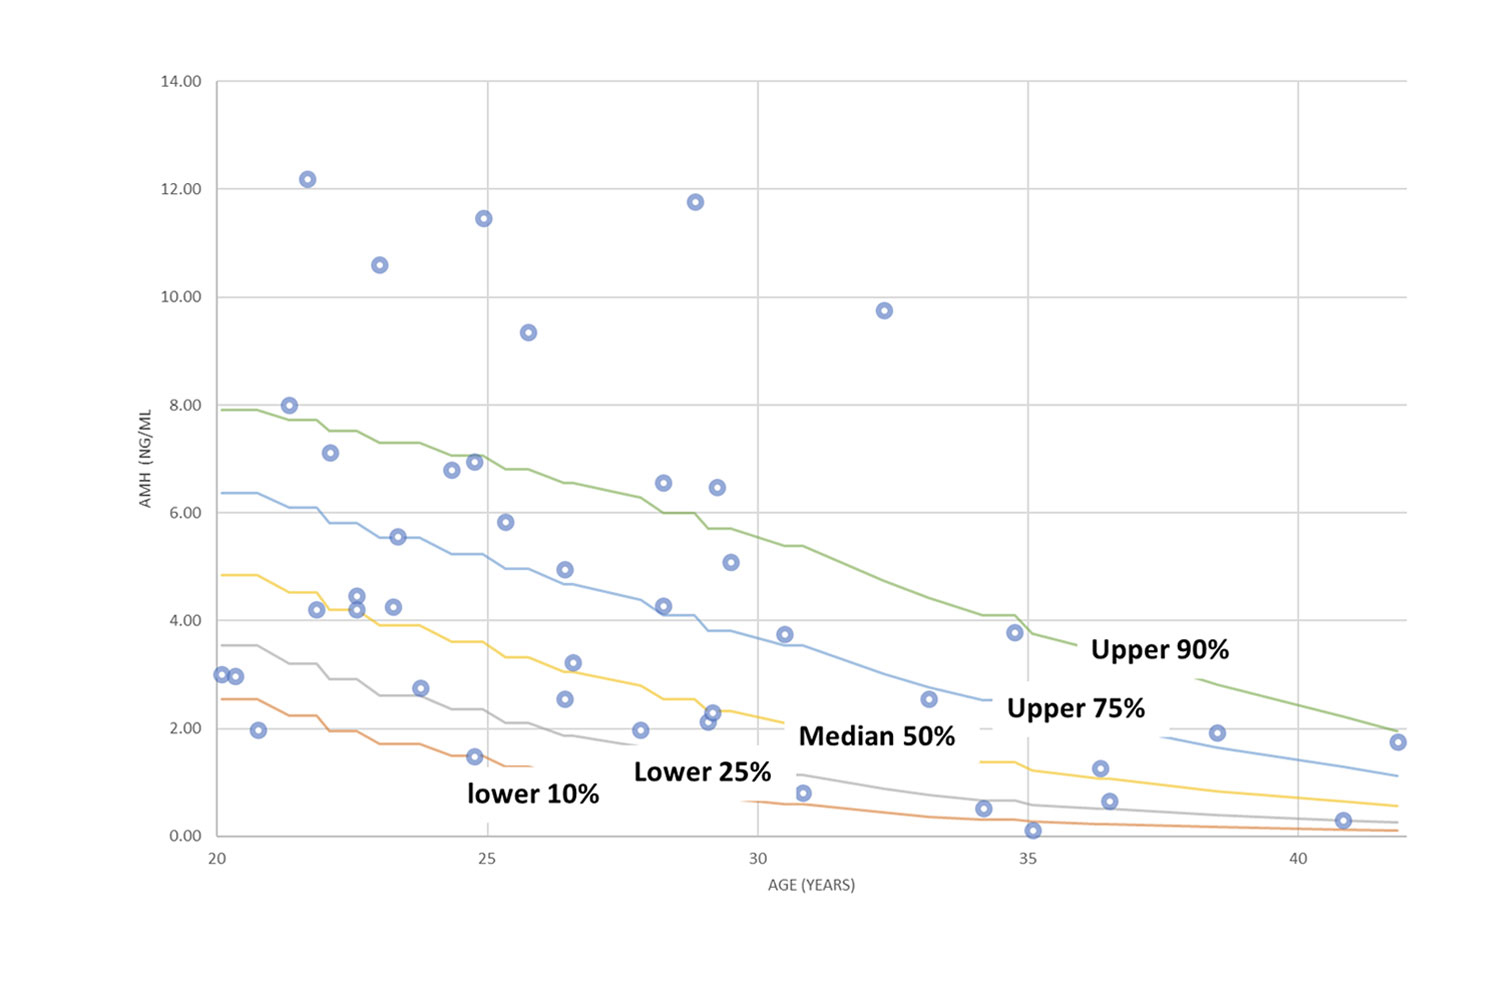
Graphical presentation of survey data
Bar chart, lines, xy scatter plot and other univariate and multivariate presentation styles
ANOVA, MANOVA, ANCOVA, MANCOVA, and GLM analyses
Analysis of variance and covariance for single, multiple, and repeatedly measured outcomes, one-way, two-way and more, followed by interactions decomposition, variance component and more.
Multiple imputation techniques
To replace missing values and missing data, to improve modeling reliability.
This technique allows the use of observations with missing data based on the distribution of the data and random selection techniques
Regression analysis, linear regression, linear probability models: logit, probit, binomial, multinomial, ordinal
All sorts of regression models with OLS and non-linear such as probability models with ordinal or categorical outcomes, also response variable with Poisson or NBD distribution.
.
Analysis of multi-level (Random Coefficient Models) data
Data organized in two or more levels, Hierarchical data analysis with variables that vary at level one or vary at higher levels using HLM, MPlus or SPSS
Longitudinal data (Individual Growth Curve Models), measuring random and fixed effects (unstructured, structured, etc.)
The analysis of multi-level data is important for data which has various sources of variance. The multi-level analysis treats levels of data separately and provides the variance explained by each level. This is extremely useful when data were repeatedly measured over time.
Dyadic analysis of variations within and between associated couples
A new approach to analyzing data that come from coupled sources such as a married couple, twins, brothers and sisters, etc.
Exploratory and confirmatory factor analysis
Factor measurements (independently or within structural equation models). Data reduction techniques to reduce number of similar variables by building unobserved factors
Cluster analysis, unsupervised grouping
The cluster analysis combines observations into groups based on the similarities and differences between them
Structural equation models that test sets of complex hypotheses where both direct and indirect effects are measured.
The structural equation model runs several regression equations simultaneously to test complex hypotheses with mediation, moderation and interaction effects
Mediation and moderation analyses of observed and unobserved instruments.
Regression models that assume an indirect effect of instrumental variables on the relationship between the dependent variable and the explanatory set of variables.
Power analysis, confidence interval and effect size examining the validity of the data and the validity of the tests and the predictiability of the results